
Westchester’s New Listings Have Likely Peaked for 2024
Westchester County: The peak for monthly new listings has likely already been reached this year. Excluding 2020, the majority of new listings typically come on the market in April or May. This year’s peak occurred in April, one month earlier than last year, and with approximately the same numbers (727 down from 731). Here’s the data I gathered from OneKey MLS®.
2013: 1,322 (April)
2014: 1,334 (May)
2015: 1,395 (April)
2016: 1,163 (April)
2017: 1,224 (May)
2018: 1,292 (May)
2019: 1,280 (May)
2020: 1,261 (June)
2021: 1,116 (April)
2022: 952 (May)
2023: 731 (May)
2024: 727 (April)
National: According to HousingWire, new listings have increased nationally. Although they have not met the weekly forecasted minimum of 80,000 during the seasonal peak, reaching only 72,329. This marks the second-lowest year on record.
Ralph’s Take
It's intriguing to compare the local market to the national scene. Nationally, inventory levels have grown more than in Westchester County; however, new listing data suggests we may have reached a bottom plateau overall. In July, only 473 single-family homes entered the market, compared to the peak of 727 in April.
The Dramatic Shift of New York's Home Prices Since March 2020
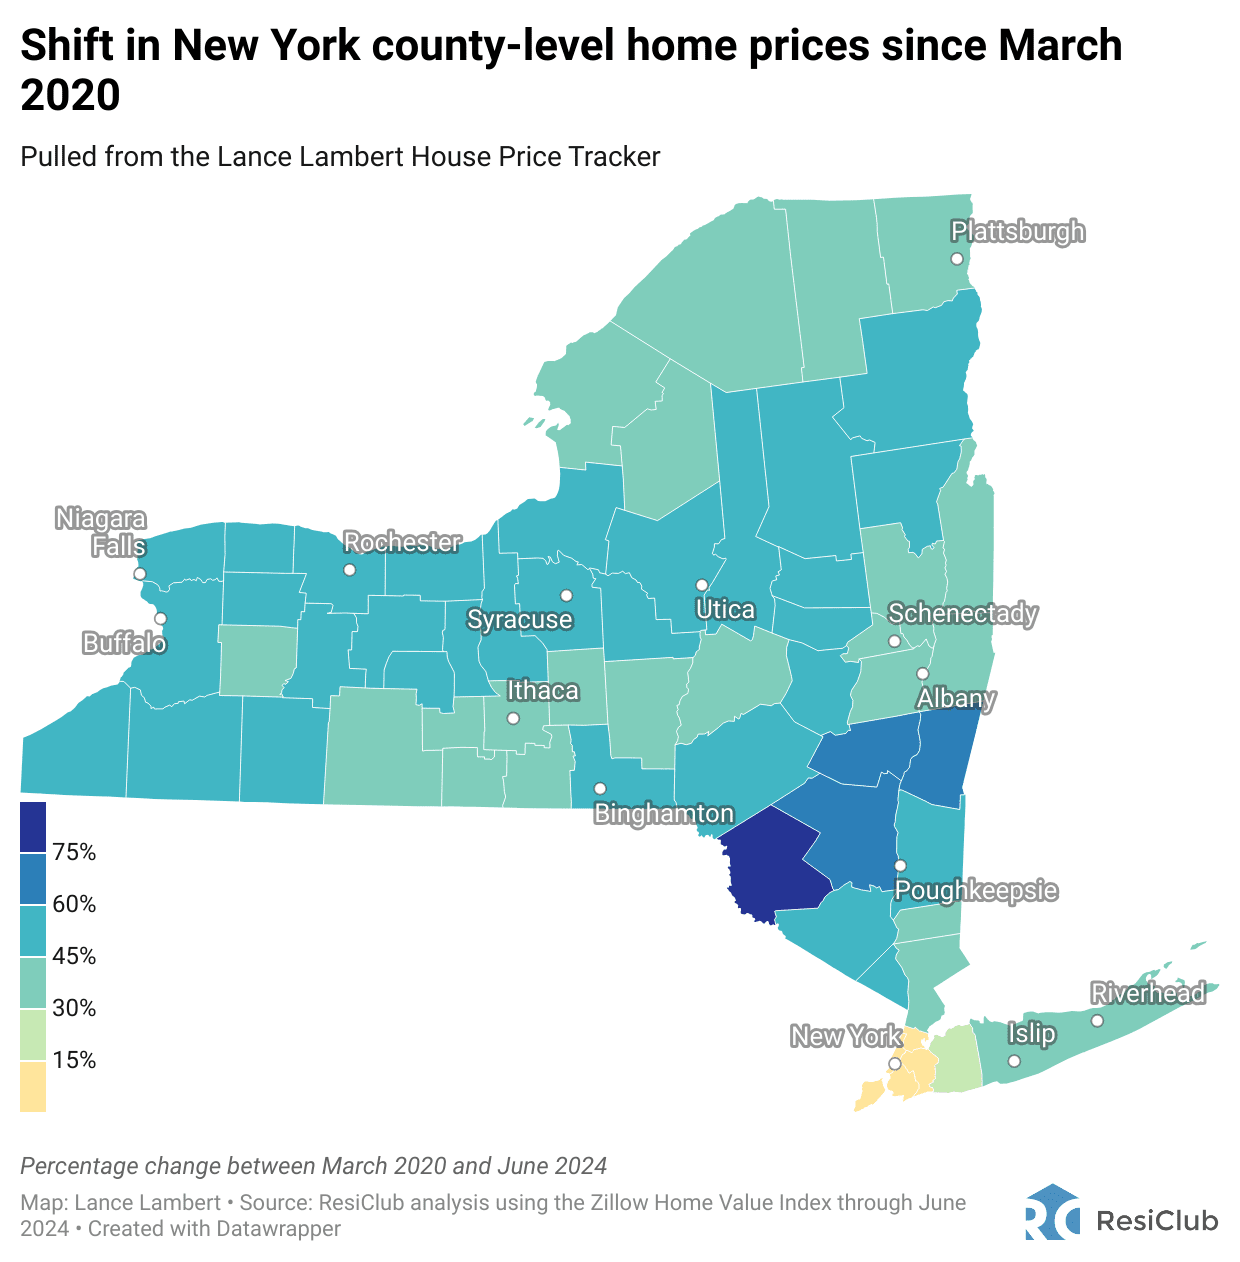
Bronx: -15.3%
Dutchess: 48.5%
Nassau: 28.6%
Orange: 54.6%
Putnam: 43.4%
Rockland: 47.4%
Suffolk: 35.8%
Westchester: 30.8%
Ralph’s Take
The pandemic initially brought uncertainty and a brief market slowdown, with Westchester County brokers unable to show properties from March 22 to June 10, 2020. However, this was soon followed by a significant surge in demand. As lockdowns and remote work prompted people to seek more space, our area saw an influx of buyers relocating from New York City. Coupled with historically low mortgage rates, these factors drove a rapid rise in home prices across the United States.
New to Market: 10,000sf English Georgian Masterpiece on 83 Acres

Welcome to an exquisite replica of "Salutation," an English Georgian masterpiece originally crafted by Sir Edward Lutyens in London. Located on an 83-acre estate in North Salem, NY, this luxurious home offers over 10,000 square feet of living space, including 10 bedrooms and multiple baths. The property features an infinity pool and an indoor pool with a spa for relaxation. Equestrian facilities include paddocks, grooms quarter, 11 stalls, a tractor barn, and a jumping field. The English-style garden, fruit trees, lily pond, and reflecting pool enhance the beauty of the grounds, which also include open fields and a large pond for fishing. Read more
Luxury Home Prices Spike 9% to All-Time High
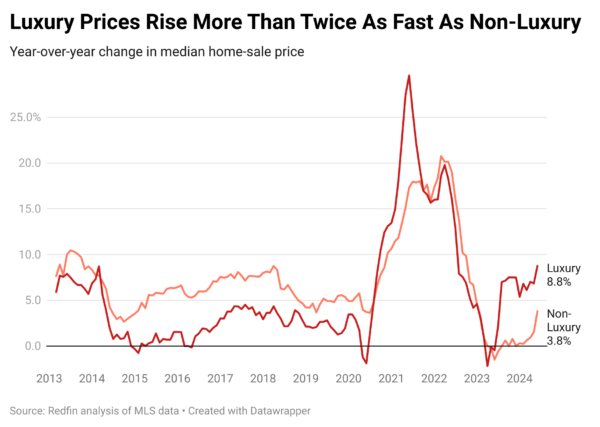
According to Redfin, luxury home prices in the U.S. have soared to a record $1.18 million, an 8.8% increase from last year and the largest in nearly two years. Luxury homes, defined as the top 5% in market value of their metro area, are in high demand with limited supply. In contrast, non-luxury home prices rose 3.8% to $342,500. Key findings from the report include:
Inventory: Luxury inventory rose 9.7%, marking the 4th consecutive quarter of growth, yet still below pre-pandemic levels.
Cash Purchases: This spring, 43.7% of luxury homes were bought with all cash, a slight increase from 43.2% during the same period last year.
Days on Market: Luxury homes remained on the market for a median of 40 days, 2 days longer than the previous year.
Ralph’s Take
These trends illustrate the widening gap between luxury and non-luxury housing markets, driven by increased cash purchases, and lower sensitivity to mortgage rates among wealthy buyers. The resilience of the luxury market stands in stark contrast to the more moderate growth observed in the general housing market.
Visual of the Week
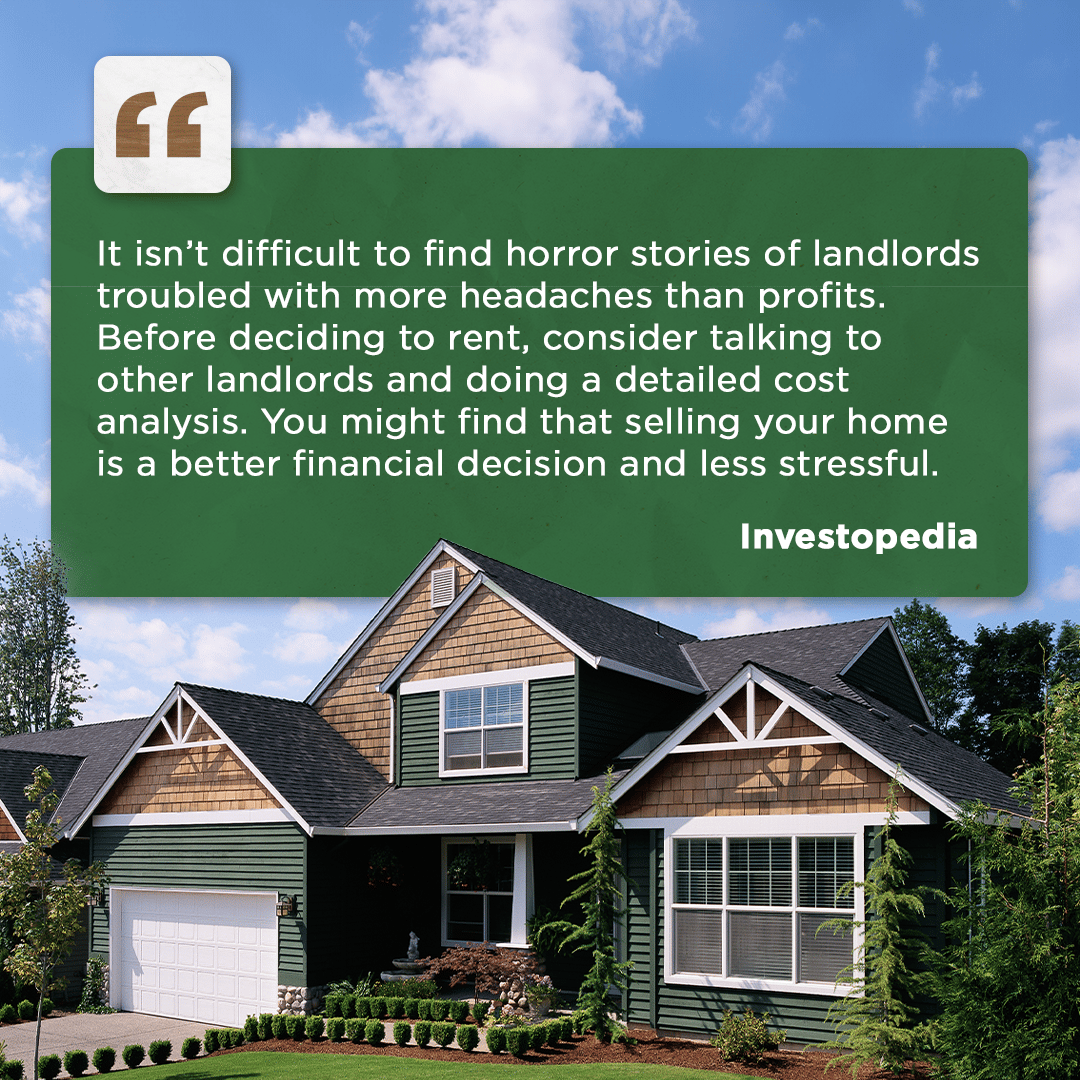
Trying to decide if you want to sell or rent out your house once you move?
There’s a lot to consider – especially when it comes to figuring out if the profit is really worth the potential pains you might come up against. Pro tip: Talking to another landlord plus professionals (like me) can help you decide what’s best for you and your situation. Read more
Mortgage Watch
The average 30-year fixed mortgage rate falls to 6.40%. 🚨 A new 52-week low. 🚨
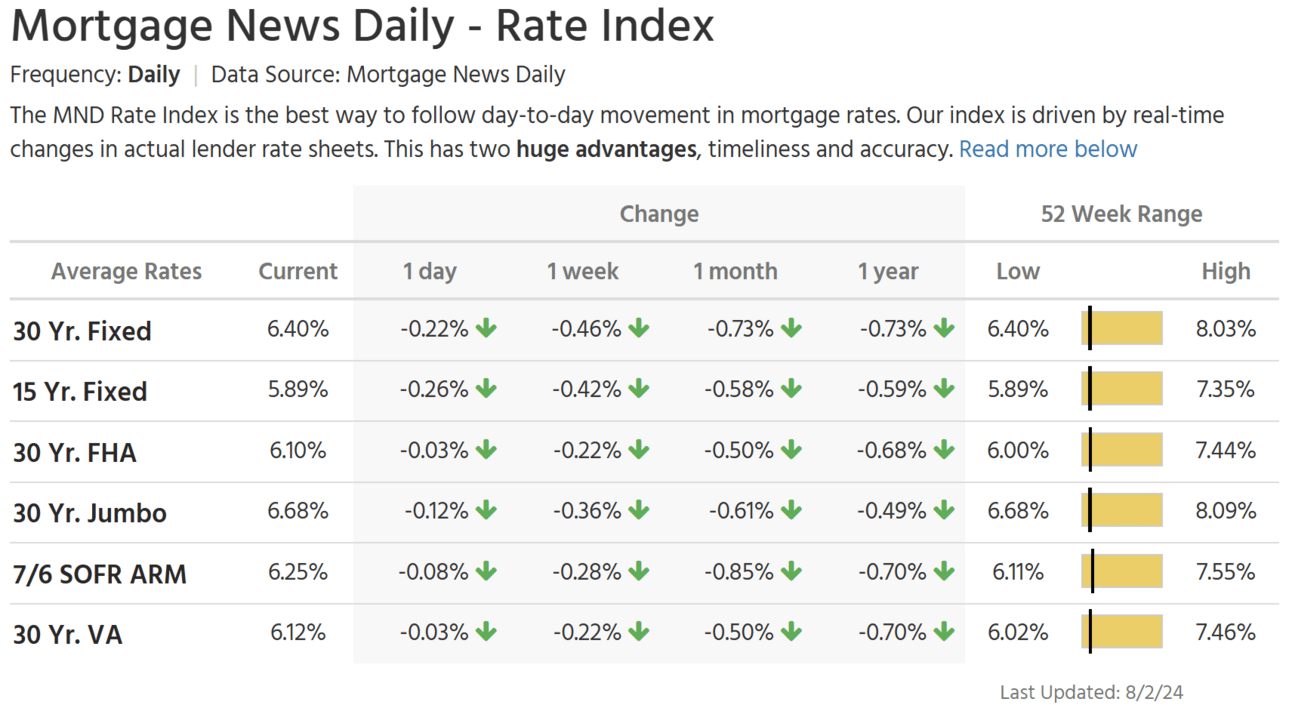
> The rate you may be eligible for can vary greatly from the daily average published via Mortgage News Daily. I use this figure as a proxy for how the mortgage market is shifting.
2024 Summer Real Estate Guides 🌞
Learn the keys to successful home buying and selling with our complimentary real estate guides.
Next week I’ll dive into the National Association of REALTORS® Settlement and what it means for home buyers and sellers.
Have real estate questions? Let me know, and I may cover your topic in an upcoming newsletter.
Thanks for reading!
-Ralph
